
Genre: a description of a line graph about urbanisation trends
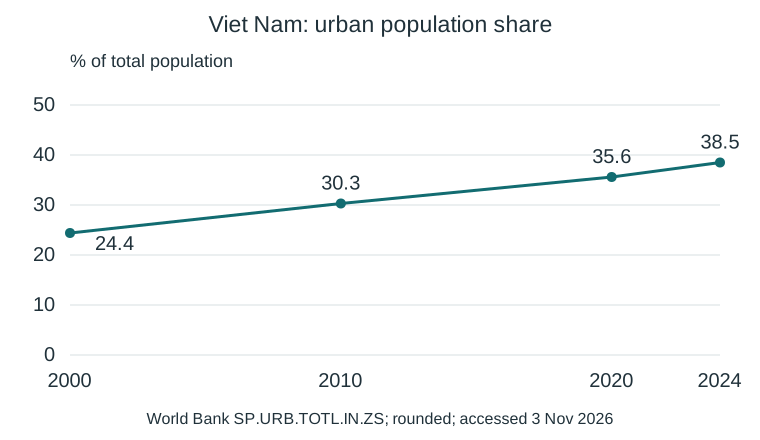
The line graph shows Viet Nam’s urban population as a share of its total population in selected years, using World Bank indicator SP.URB.TOTL.IN.ZS as accessed on 3 November 2026. The rounded figures are 24.4% in 2000, 30.3% in 2010, 35.6% in 2020 and 38.5% in 2024. Overall, the share increased throughout the selected period. It rose by 5.9 percentage points from 2000 to 2010 and by 5.3 points over the following decade. From 2020 to 2024, it increased by a further 2.9 points. The total rise shown is 14.1 percentage points, not a 14.1% relative increase. The graph describes the national urban share; it does not show Hà Nội alone or explain how much change came from migration, natural increase or reclassification. Later database revisions may differ from older textbook figures.