
Genre: a description of pie charts
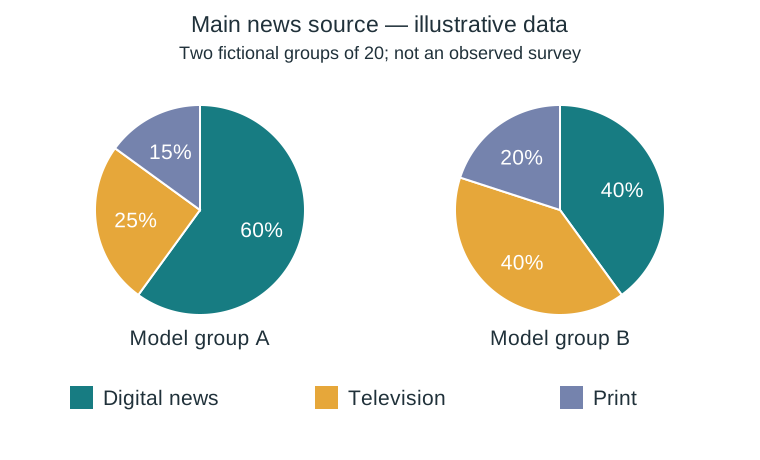
The two pie charts present illustrative class-survey data, not a survey actually conducted. In the first model group of twenty respondents, twelve mainly use digital news, five television and three print; the shares are 60%, 25% and 15%. In the second model group, eight choose digital news, eight television and four print, corresponding to 40%, 40% and 20%. Digital news is the largest category in the first group, while digital news and television are equal in the second. The digital share differs by 20 percentage points. These charts compare the main source selected by each respondent, not all the media they use. Because the groups are small and fictional, the figures cannot support a claim about all teenagers. A real report would state the question, sample and date before interpreting the results.